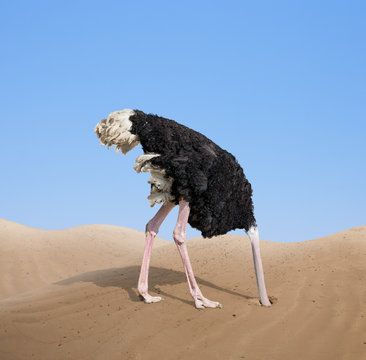
New research guidelines posted!!

New research guidelines posted!!

Well, yeah, I guess they remove smoke detectors from their houses, as they could create smoke anxiety when a fire breaks out ¯_(ツ)_/¯
from the "minds" that brought us if-we-just-stop-testing-there'll-be-no-cases...
Don't look up!
Maybe they should make it illegal to say "measles" too.
I know it's unlikely without a major lab oops, but I've put smallpox back on my bingo card.
The Princeton cuts are a slap in the face to all those who need better seasonal precipitation forecasts,” said Rick Spinrad, the administrator of NOAA during the Biden administration, noting the importance of such forecasts to the agriculture, transportation and energy sectors.
This is a big one, though seasonal forecasts tend to be iffy. Overall, property owners/potential buyers should have an idea of how bad it is, or going to get how soon.
Discussion of climate, how it is changing, activism around that, the politics, and the energy systems change we need in order to stabilize things.
As a starting point, the burning of fossil fuels, and to a lesser extent deforestation and release of methane are responsible for the warming in recent decades:

How much each change to the atmosphere has warmed the world:

Recommended actions to cut greenhouse gas emissions in the near future:

Anti-science, inactivism, and unsupported conspiracy theories are not ok here.