this post was submitted on 08 Oct 2024
82 points (100.0% liked)
hopeposting
1750 readers
1 users here now
Proof of the indomitable human spirit.
Rules:
- Posts must inspire hope or highlight the beauty of existence
- Posts and comments harassing or antagonizing a real person will be removed
- Posts mentioning religious topics are allowed but religion should not be the main point of the post. E.g. “God’s beautiful world” is fine because of the “beautiful world” part, but “God loves you” isn’t because religion is the focal point
- Posts and comments judging group of people in negative way based on stereotype will be removed.
- No posts with toxic positivity. All human emotions are valid.
- Staight up doomer/doomer-trolling comments will be removed. Reasonable disscustion and asking for hope is fine.
founded 2 years ago
MODERATORS
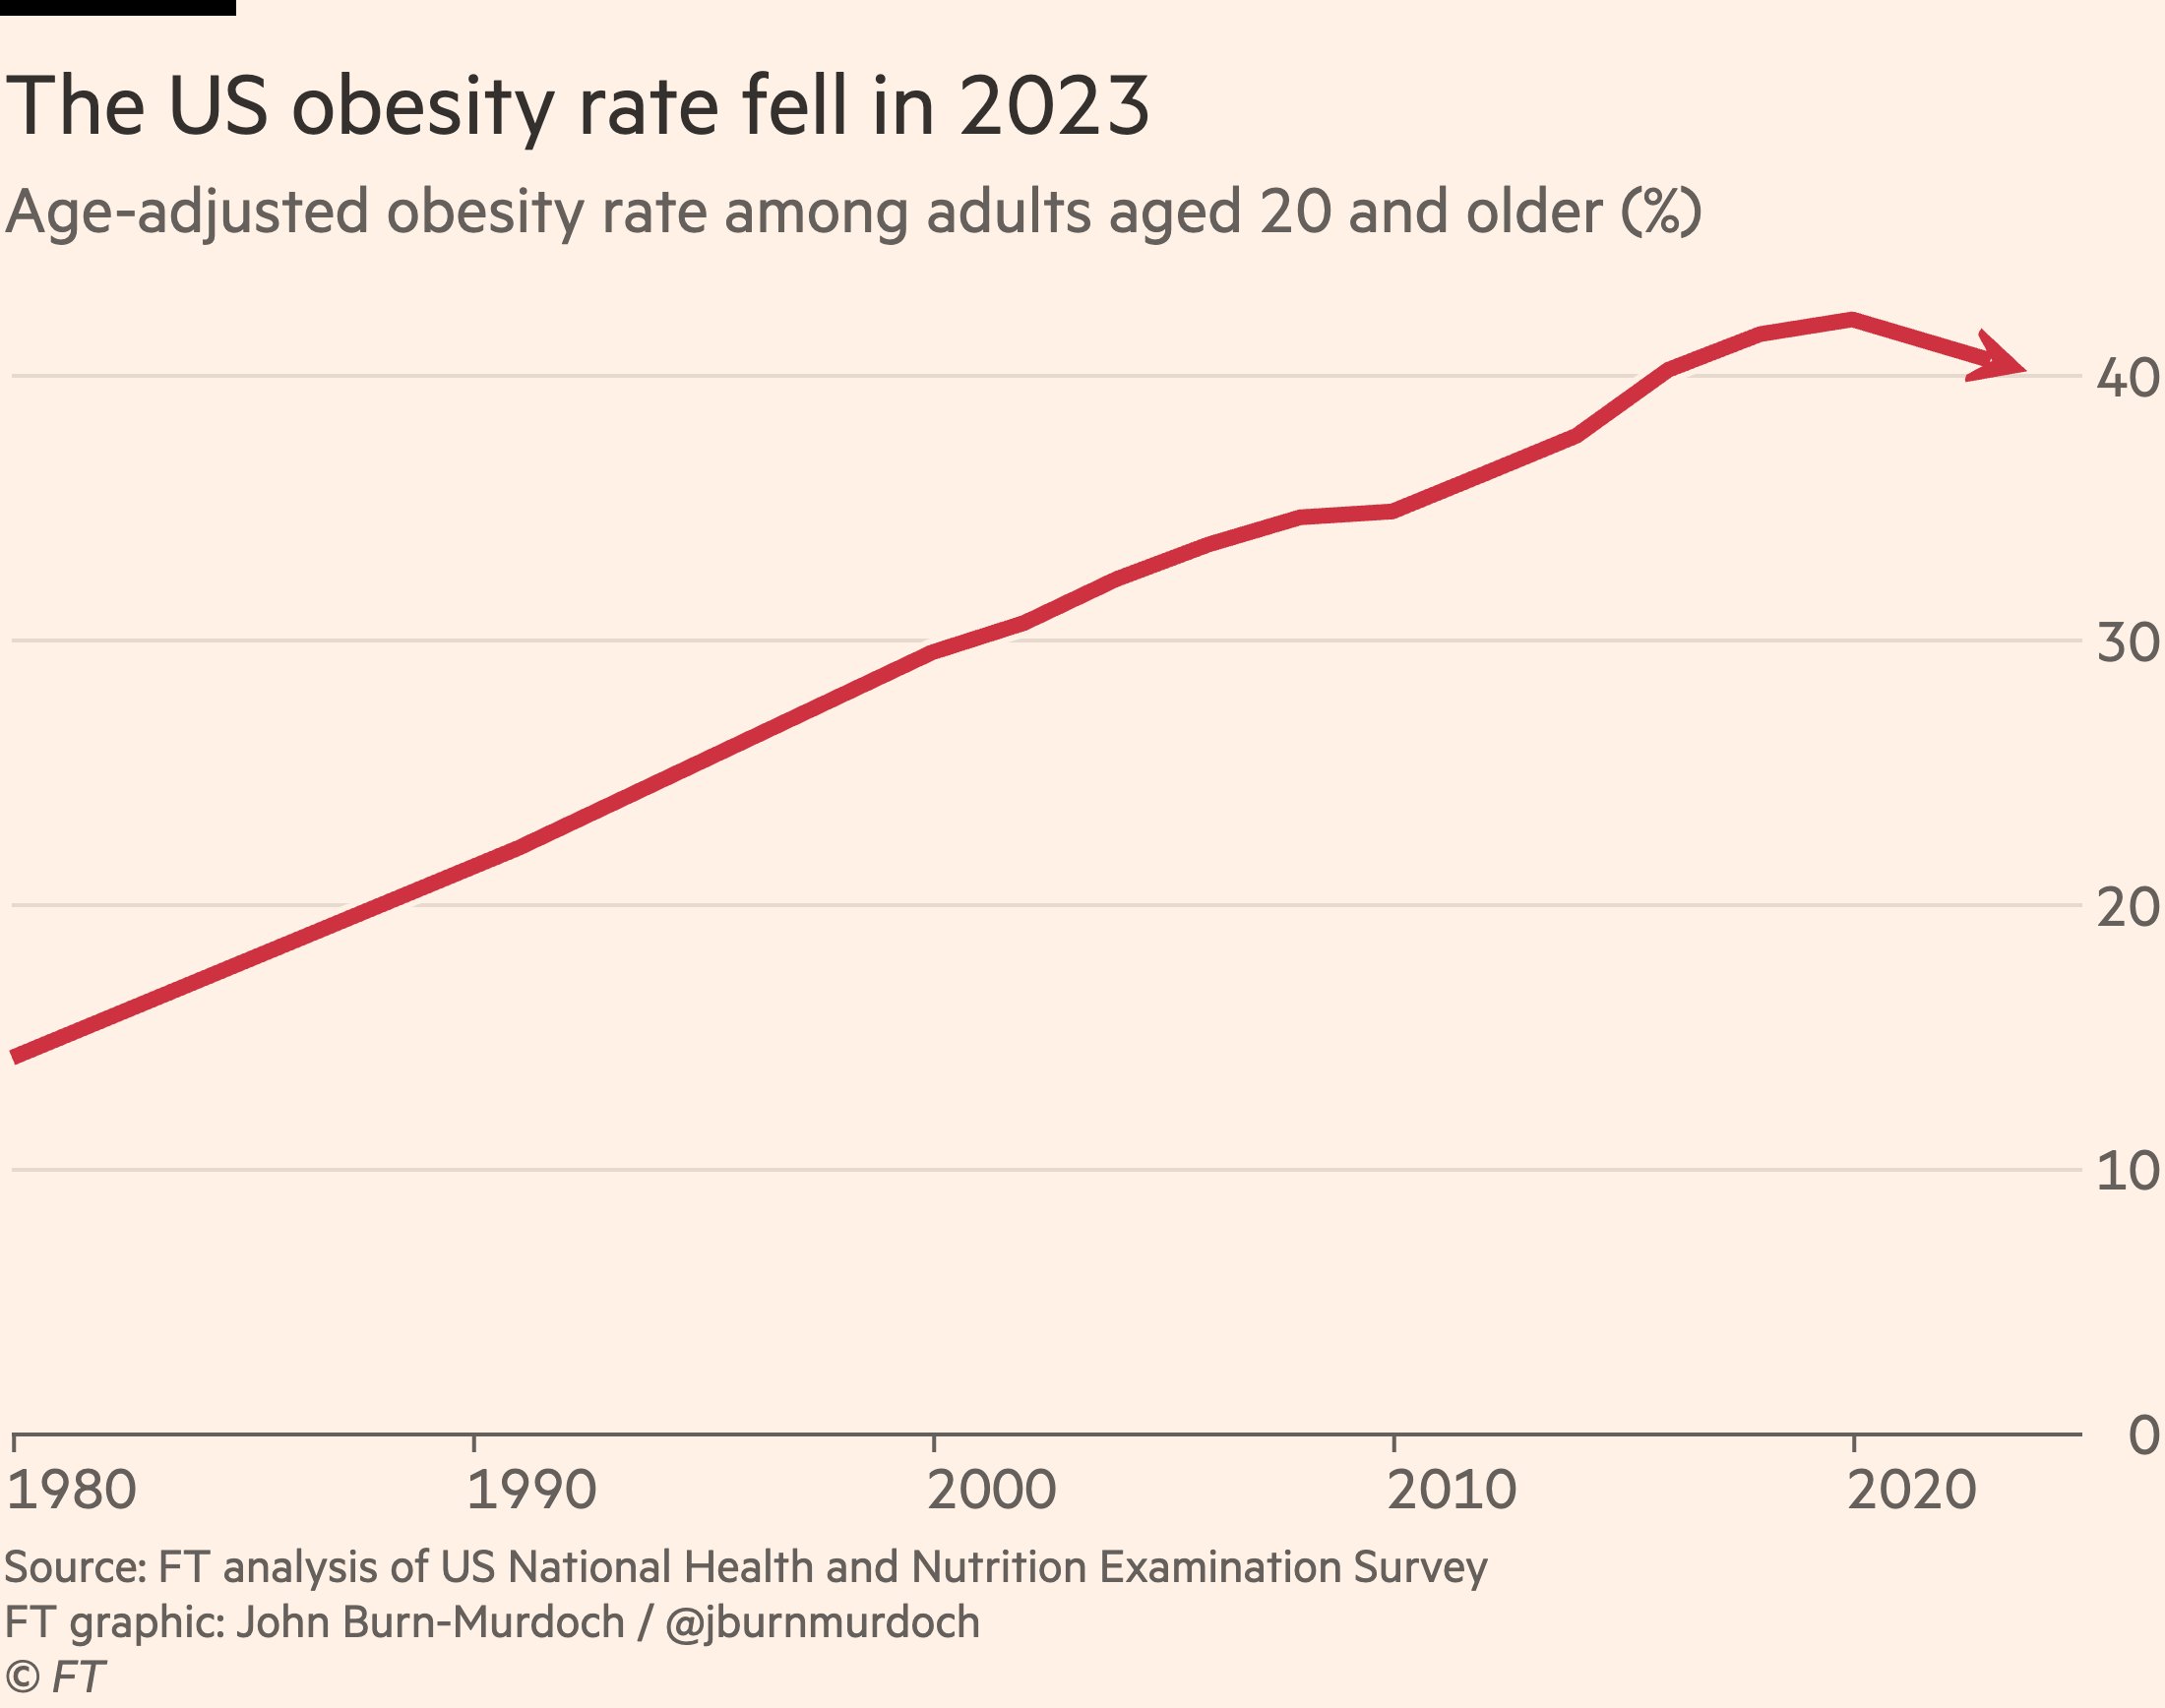
I tried to find the data, it looks like the financial times evaluated data from August 2023 and made that chart? This is apparently the survey source with a lazy google: https://wwwn.cdc.gov/nchs/nhanes/continuousnhanes/default.aspx?Cycle=2021-2023 cause i was curious too