624
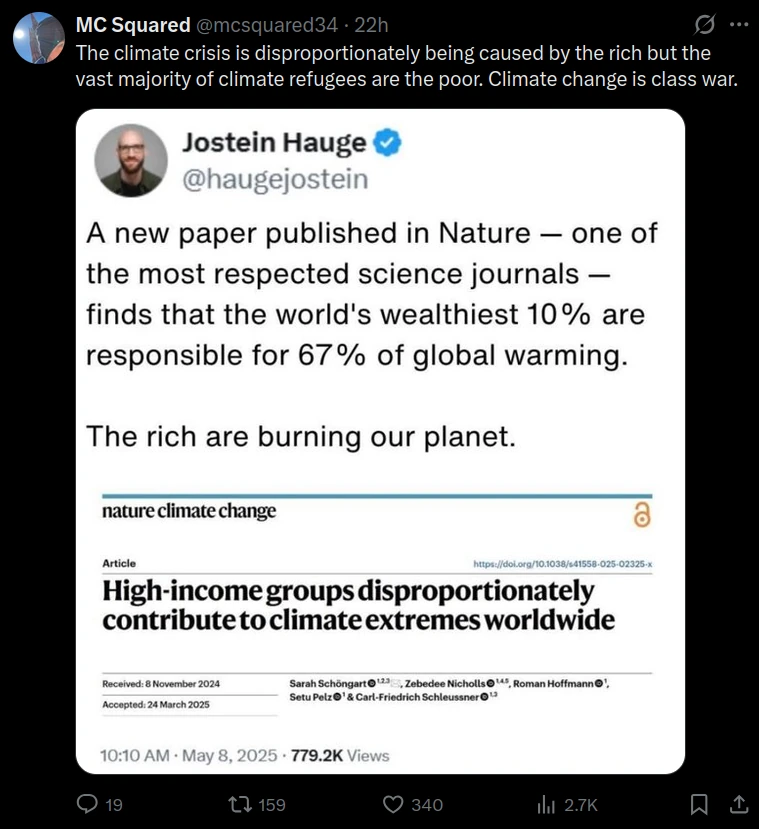
Class war solves most issues
(slrpnk.net)
Discussion of climate, how it is changing, activism around that, the politics, and the energy systems change we need in order to stabilize things.
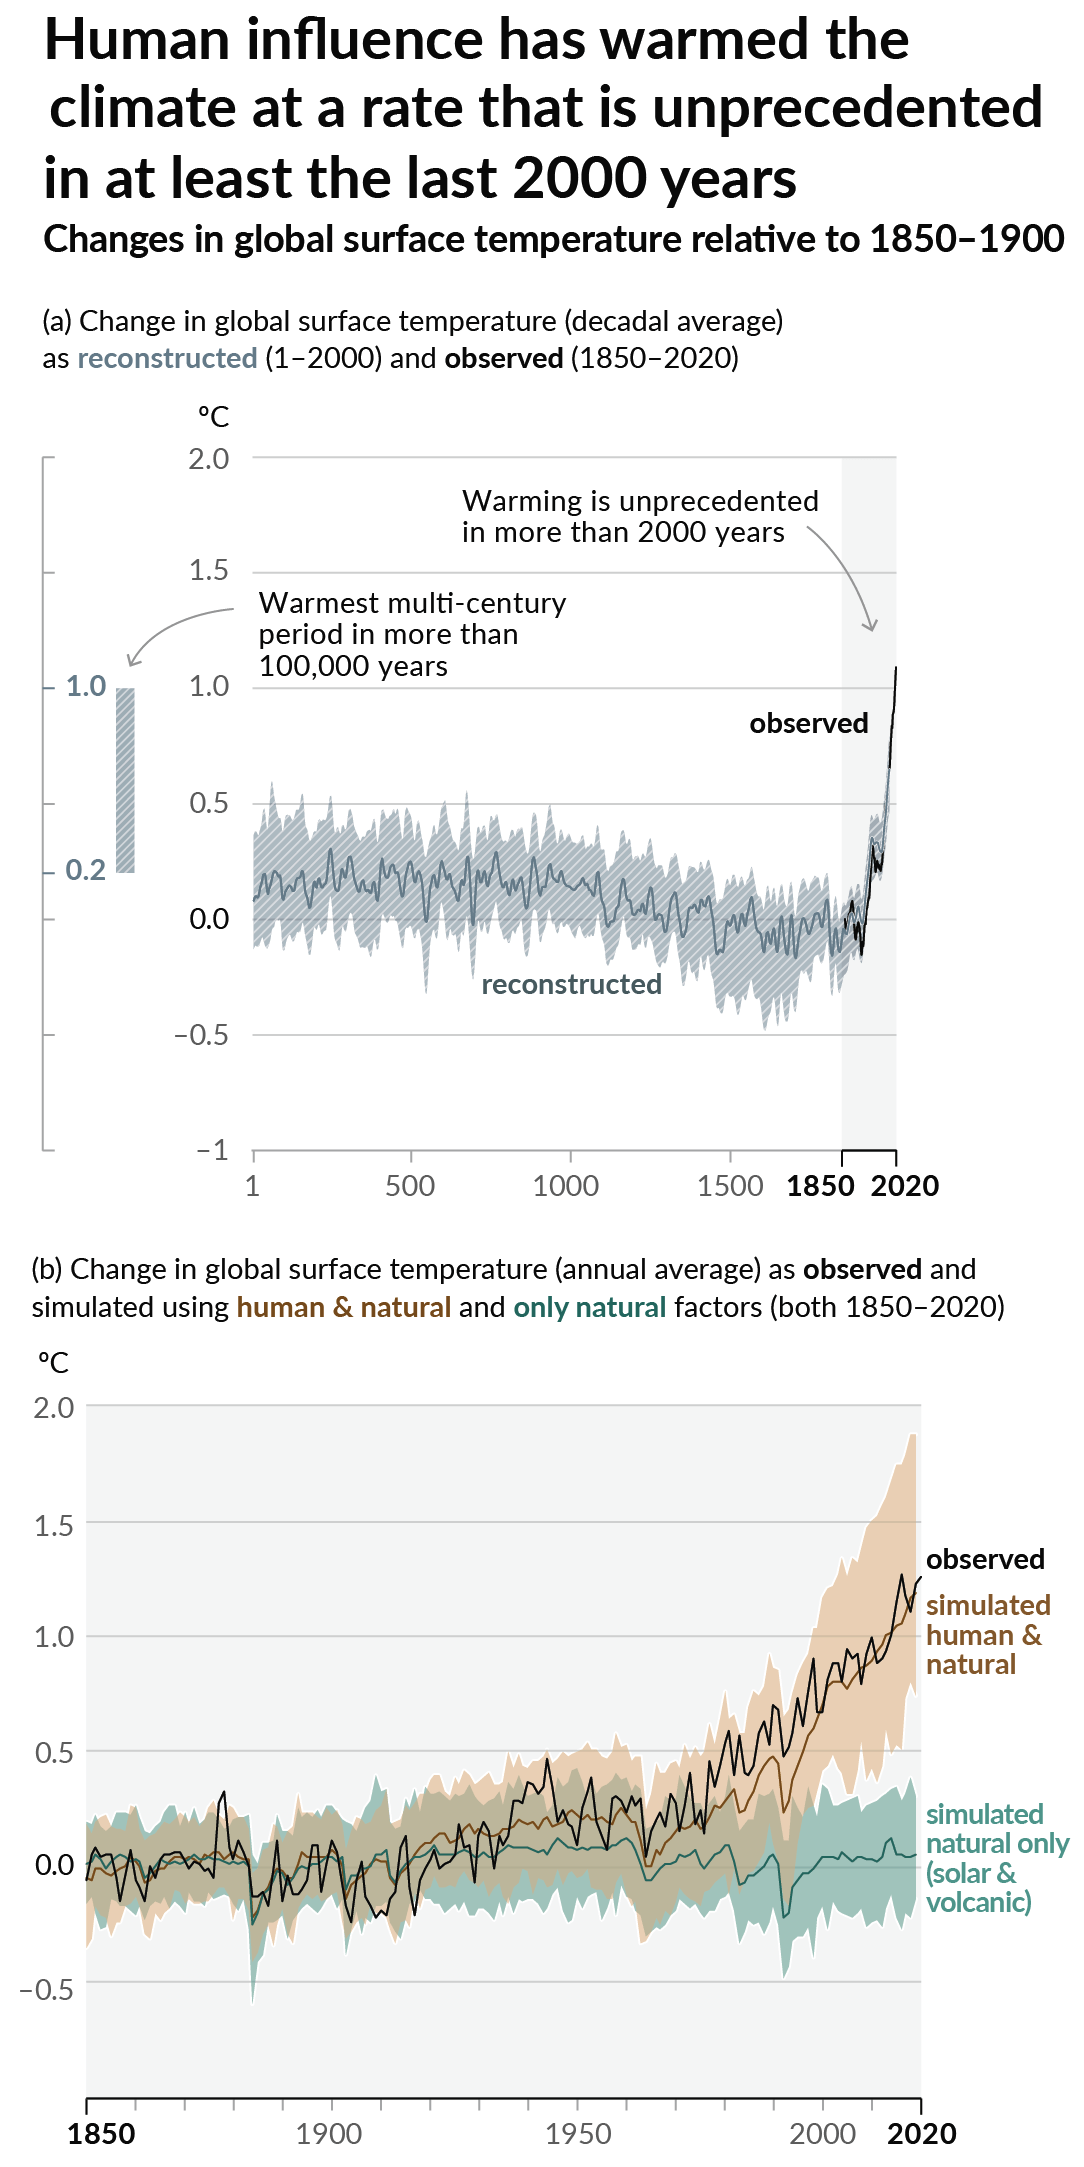
As a starting point, the burning of fossil fuels, and to a lesser extent deforestation and release of methane are responsible for the warming in recent decades:
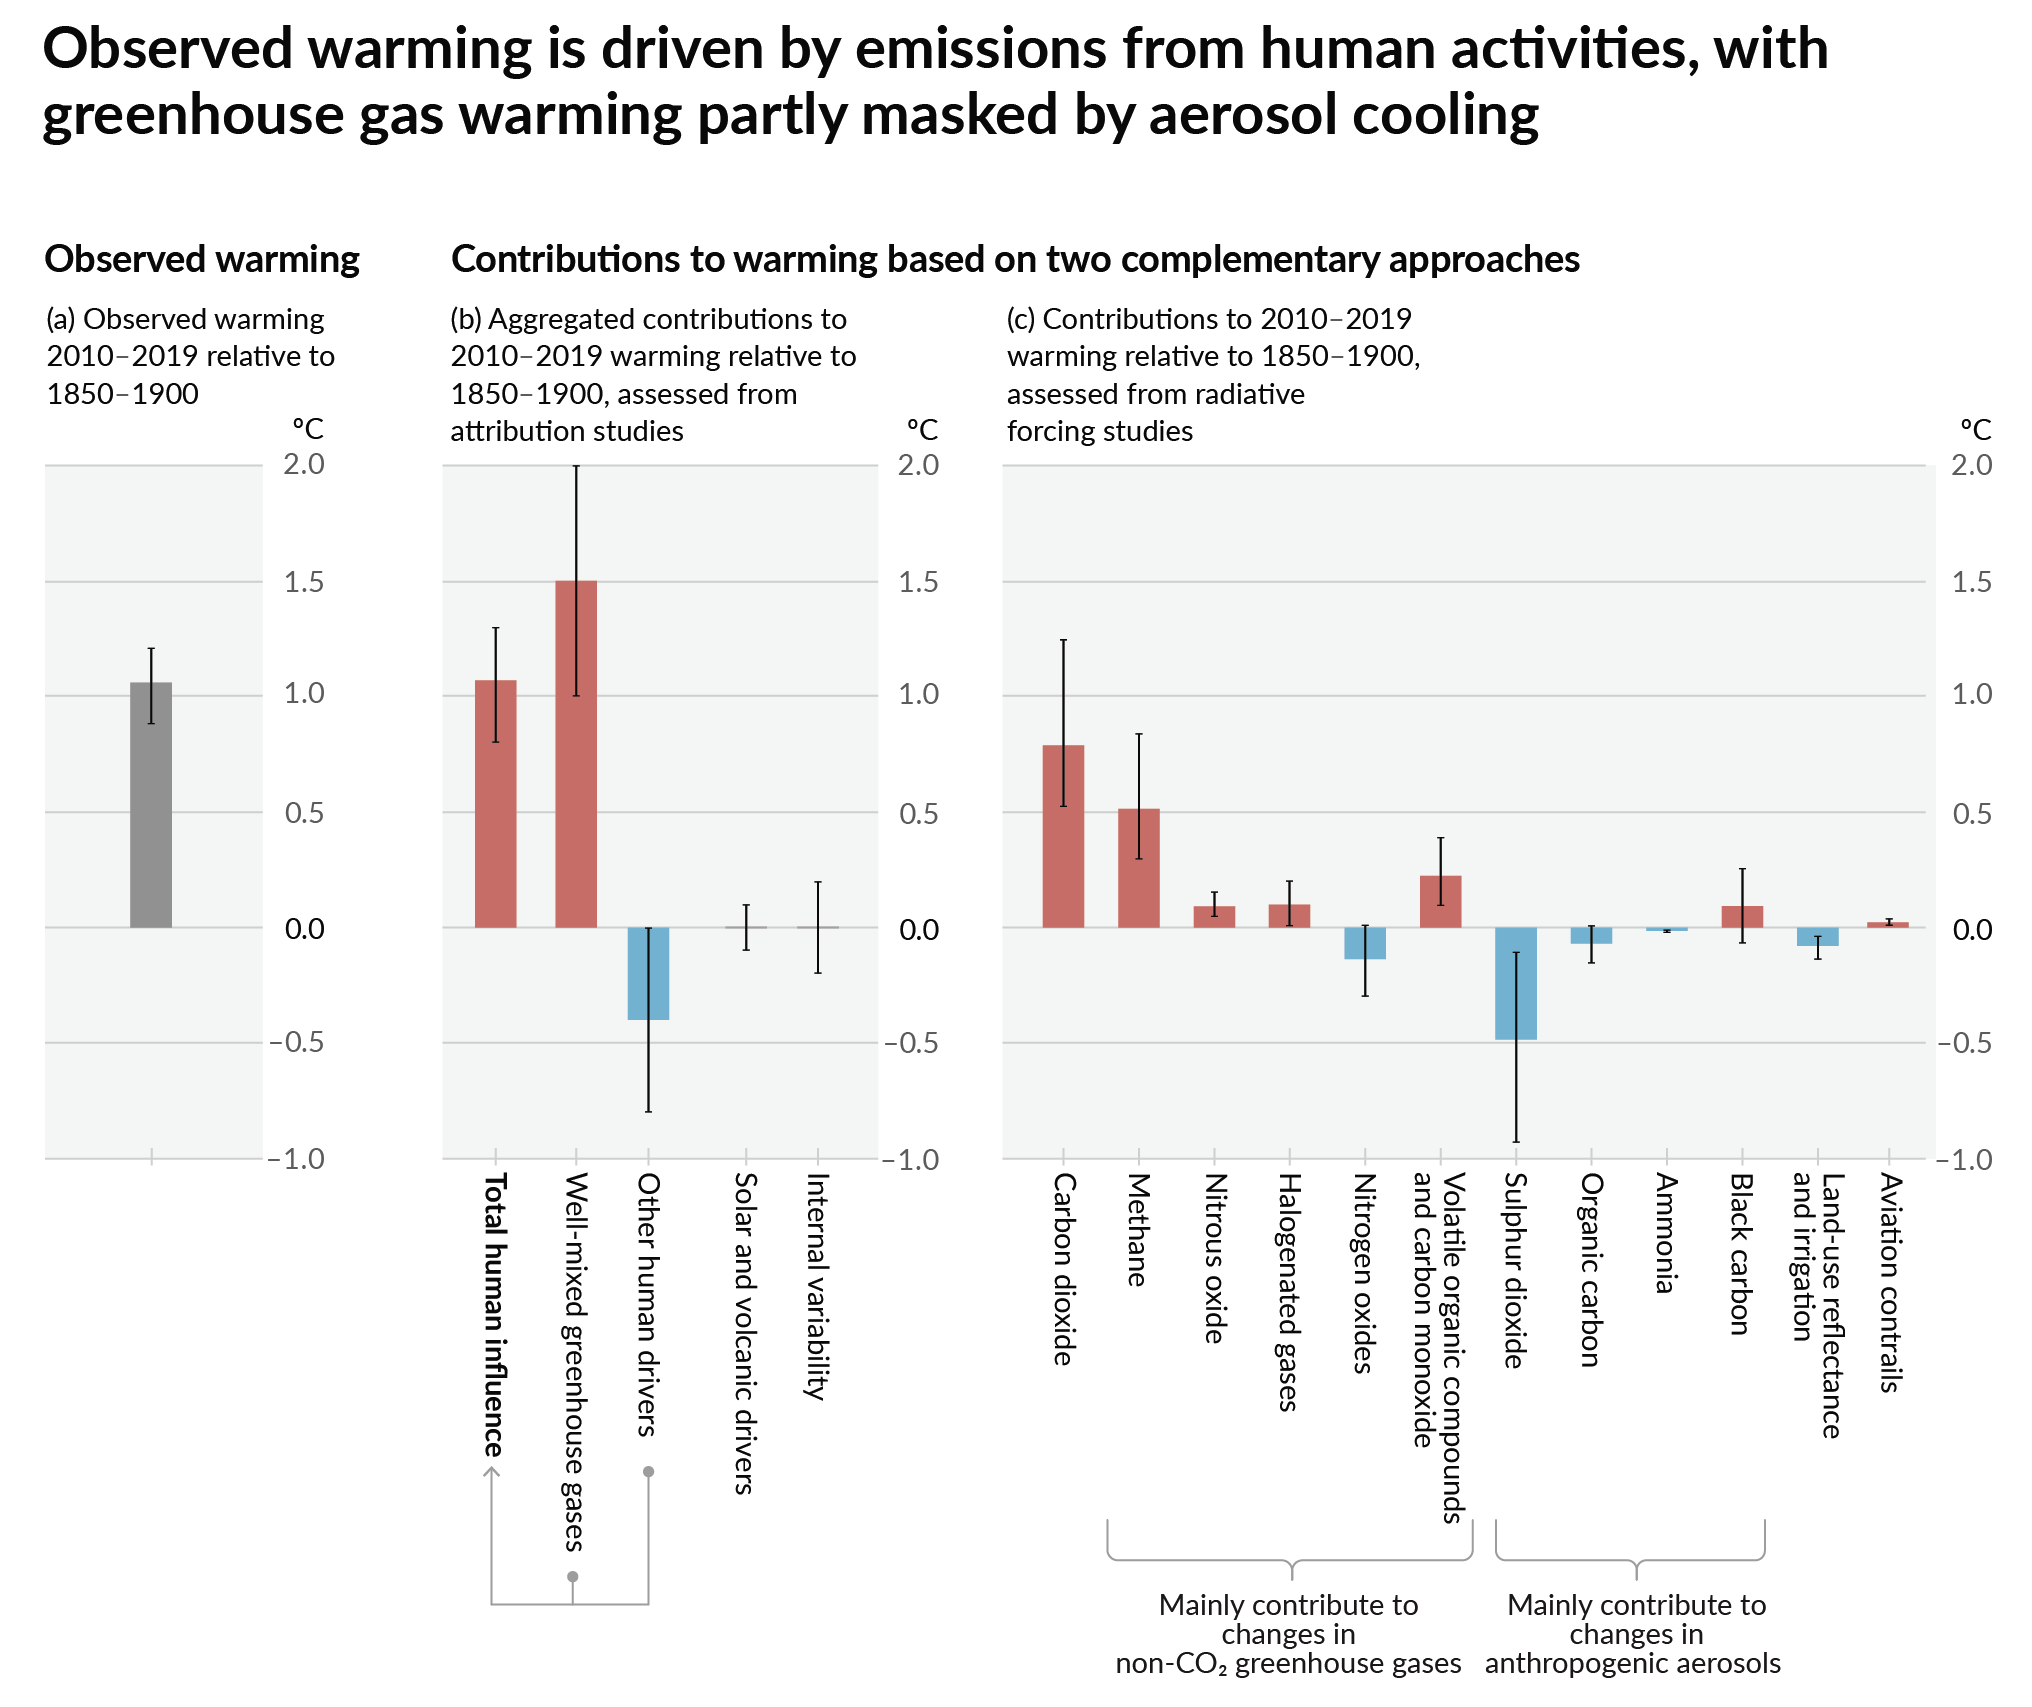
How much each change to the atmosphere has warmed the world:
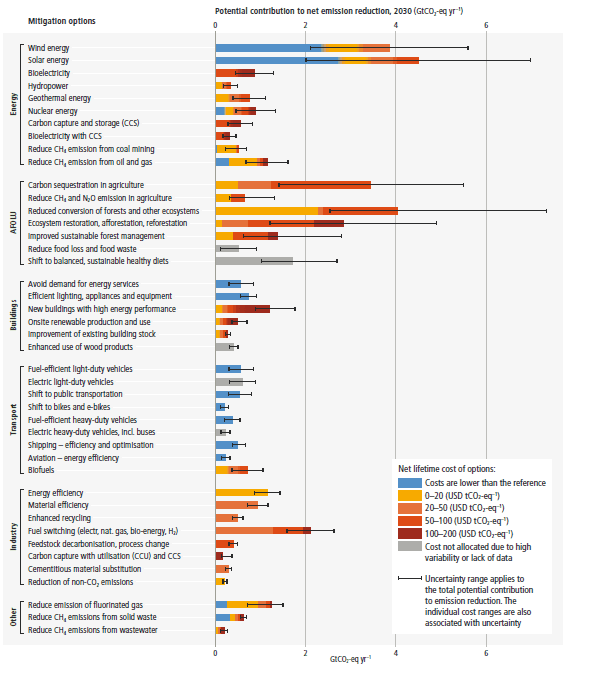
Recommended actions to cut greenhouse gas emissions in the near future:
Anti-science, inactivism, and unsupported conspiracy theories are not ok here.
Median household income was $83,730 in 2024
That's going to include dual income households as well as single income, so the $70k threshold for being in the top 10% may actually include some people below median, depending on what the distribution of single vs dual income households happens to be.
Point being, since we're being pedantic today, is that being anywhere above median income in a developed nation means you are likely in the global top 10%.
Yeah.... the Median individual income is only 45k. So it kinda depends if the 70k threshold was accounting for household or single. If it's just a single income then around 75% of Americans would not make it to the top 10%.
Household income is kinda a skewed way to evaluate income, especially considering that a lot of households do not share expenses equally. Younger generations could have 5 roommates and not make the 85k median.
Oh by "western world" you meant the US and not developed country or european culture country.